




Maximize Your Crypto Investment Returns with the Power of Artificial Intelligence
In the volatile world of Cryptocurrency, making decisions based on accurate and timely data is the key to success. The AI Analysis module on CoinXSight (coinxsight.com/analysis) is designed to be your ultimate assistant, providing deep, comprehensive analysis ranging from technical indicators to on-chain data, without requiring you to be a seasoned expert.
This guide will walk you through, step-by-step, how to use this powerful tool to uncover the best investment opportunities.
1. Interface Overview
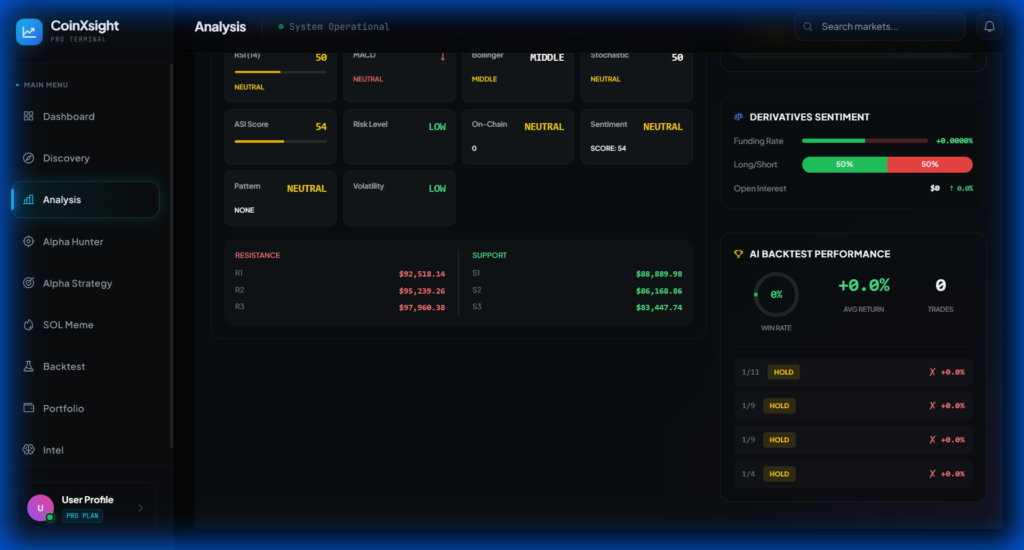
Upon accessing the Analysis Module, you will be greeted by an intuitive interface divided into precise functional zones. Our AI automatically aggregates data from millions of news sources, trading activities, and on-chain metrics to provide real-time assessments.

Key Features:
- Smart Search: Quickly look up any cryptocurrency.
- Technical Chart: Integrated with automated Pattern Recognition.
- AI Score & Signals: A composite score evaluating the coin’s health.
2. Detailed Feature Guide
A. Search & Basic Data
At the top bar, you can enter the name or symbol of the coin you are interested in (e.g., BTC, ETH, SOL). The system will instantly display:
- Current Price & 24h Change.
- 24h Range: Helps you understand if the price is currently at the day’s low or high.
- Volume & Market Cap: Assess liquidity and market size.
B. AI Insights: The Core of the System
This is the most valuable section, where the AI tells you exactly what to do.
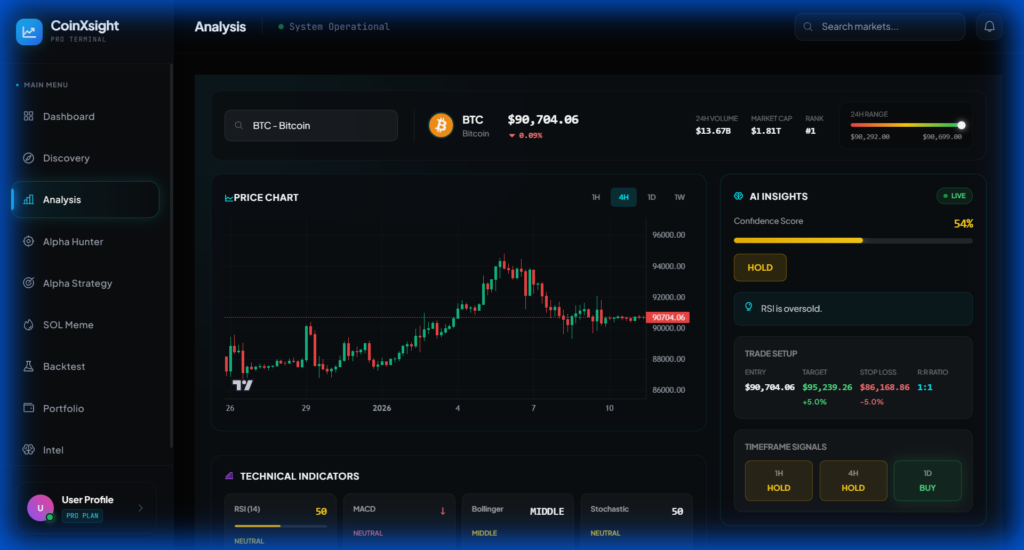
- Confidence Score:
- Scale from 0-100.
- > 70 (Green): Very strong signal (Strong Buy/Sell).
- 40 – 60 (Yellow): Neutral or unclear signal (Hold).
- < 30 (Red): High risk warning or strong reversal signal.
- Meaning: The higher the score, the more accurate the AI’s prediction is based on historical performance.
- Trade Setup:
The AI automatically proposes a specific trading plan:
- Entry: Recommended price zone to enter the trade.
- Target (TP): Profit target (calculated based on resistance levels).
- Stop Loss (SL): Loss cut point (based on the nearest support).
- R:R Ratio: Risk/Reward Ratio. The higher this ratio (e.g., 1:3), the more attractive the trade.
- AI Reasoning:
The AI explains why it is giving that signal in natural language.
Example: “RSI is Oversold, while a ‘Falling Wedge’ pattern is forming, signaling a potential bullish reversal.”
C. Technical Indicators
The system displays the status of popular indicators without you needing to draw charts manually:
- RSI (Relative Strength Index): Measures price momentum. (Overbought > 70, Oversold < 30).
- MACD: Identifies trends. (Bullish = Upward, Bearish = Downward).
- Bollinger Bands: Measures volatility. “Squeeze” means price is compressing and a major move is imminent.
D. Derivatives & On-Chain (Smart Money Flow)
For advanced users looking to track “whale” movements:
- Funding Rate:
- Positive (+): Longs are dominant (paying Shorts).
- Negative (-): Shorts are dominant.
- Long/Short Ratio: The ratio of traders betting on price going up vs. down.
- Open Interest (OI): Total number of open contracts. Rising OI + Rising Price = Strong sustainable uptrend.
3. Performance Verification (Backtest)
We ensure transparency in our AI’s predictive capabilities through the Backtest feature.
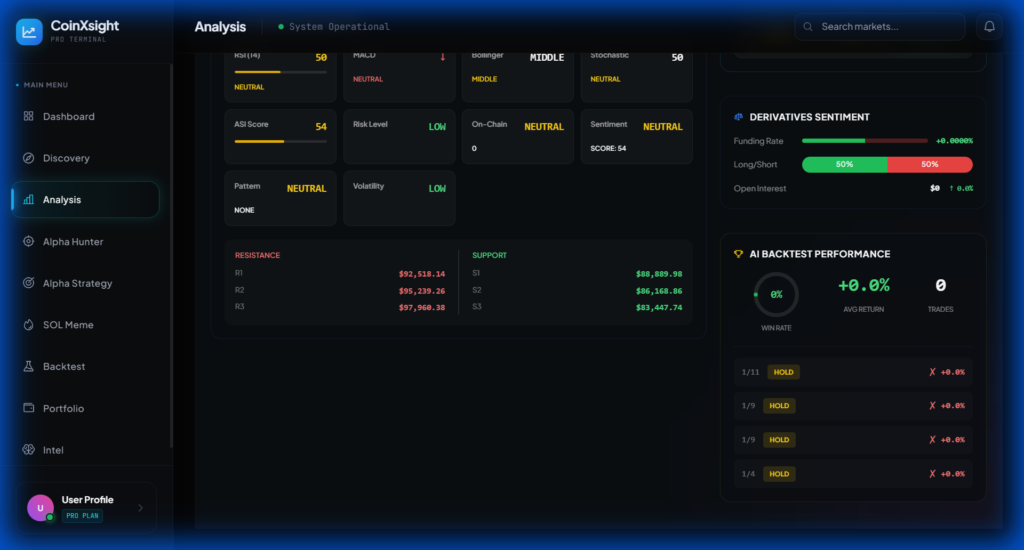
- Win Rate: The winning percentage of historical signals.
- Avg Return: Average profit per trade.
- History: A log of past AI calls (Buy/Sell) and the actual outcome.
Tip: Choose coins with a high Win Rate (>60%) on your preferred timeframe for increased safety.
4. Glossary
To help you get started easily, here are explanations of technical terms used in the module:
- ASI (AI Sentiment Indicator): A composite sentiment score derived from news, social media, and price data to measure crowd psychology.
- Volatility: The degree of price fluctuation. High volatility offers high rewards but comes with higher risk.
- Support / Resistance: Price levels where the trend is expected to pause or reverse. (Support is the floor, Resistance is the ceiling).
- Whale Activity: Transactions by large wallets. Whales accumulating is often a bullish sign.
- On-Chain Signal: Signals derived from blockchain data (e.g., net outflow from exchanges is a positive/holding signal).
5. Mobile Interface Experience
We understand that crypto opportunities don’t wait. The CoinXSight mobile interface is optimized to deliver the same powerful insights as the desktop version, right in your pocket.
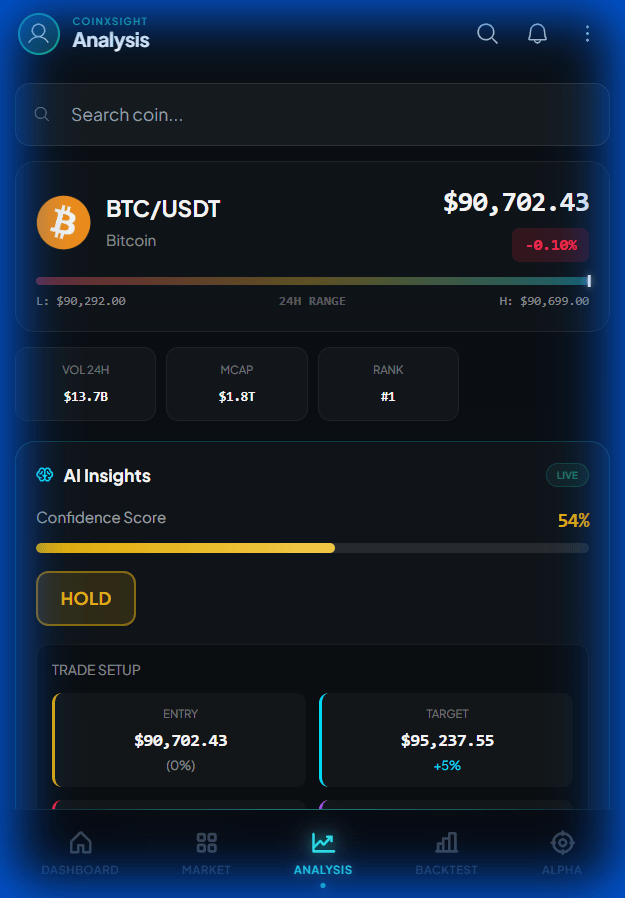
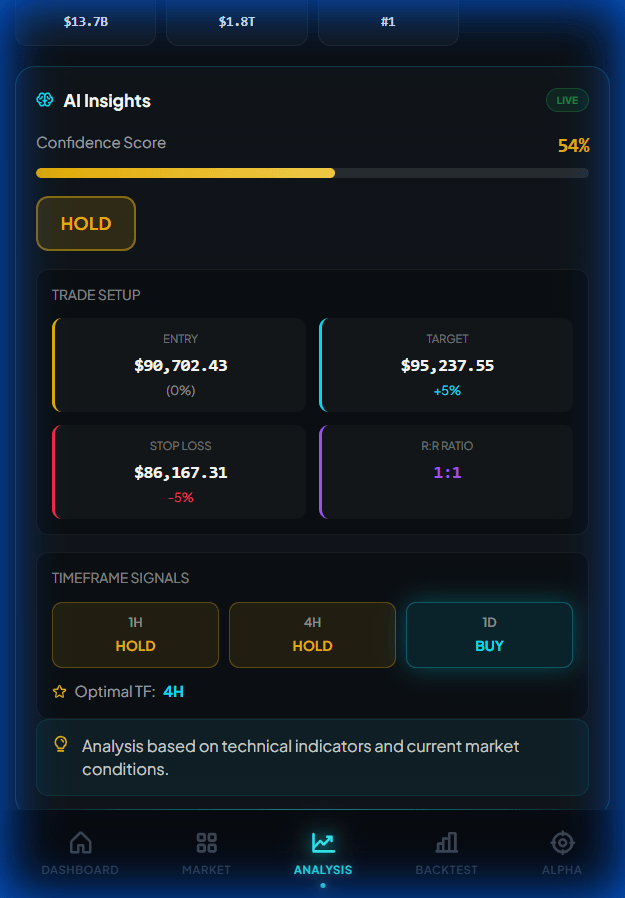
Key Differences on Mobile:
- Vertical Scrolling: All sections (Price, AI Insights, Charts, Indicators) are arranged vertically for smooth one-handed navigation.
- Compact Charts: The Price Chart and Pattern Recognition are optimized to fit mobile screens while retaining clarity.
- Touch-Friendly Sliders: Swipe horizontally on the Indicators Overview section to quickly check Risk, Sentiment, and On-chain metrics.
- Bottom Sheet Details: Tap on any indicator to open a detailed explanation card without leaving the main page.
Conclusion
The AI Analysis module on CoinXSight is not just a charting tool; it is a 24/7 investment advisor. By combining traditional technical analysis with AI data processing power, we help you eliminate emotional bias and make decisions based on real data.
Start today: Visit coinxsight.com/analysis, search for your favorite coin, and let AI lead the way!
Disclaimer: The Cryptocurrency market is highly risky. AI analyses are for reference and decision support purposes only and do not constitute financial advice for any specific individual.
Discover more from aiCryptoHub.io
Subscribe to get the latest posts sent to your email.


