

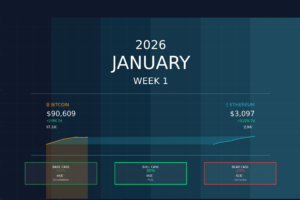



Bitcoin and Ethereum start 2026 with modest gains but significant uncertainty. After a volatile week marked by institutional inflows, whale repositioning, and mixed on-chain signals, the market faces a critical decision: sustain the relief rally toward $98K–$102K, or correct sharply to reset excessive short-term hype. This forecast provides three concrete scenarios, key levels to watch, and practical trade templates for the week ahead.
TL;DR (Week 2 Forecast in 60 Seconds)
- BTC: Consolidating $88K–$95K range; base case (50% probability). Bull case $98K–$102K if Fed dovish + technical breakout. Bear case $82K–$85K if macro shock or whale selling hits.
- ETH: Relative weakness vs. BTC; overbought on daily RSI (68). Warning: historic network growth spike (Jan 7) often precedes short-term corrections to $2,600–$2,800 (Santiment alert).
- Key drivers this week: Fed Chair nomination (dovish = tailwind), ETF flow stability, whale exit liquidity risk, lack of fresh leverage (positive for avoiding cascade).
- Invalidation watch: BTC below $88K breaks support; ETH below $2,900 = floor lost.
- Sentiment: Fear & Greed at 25–42 (capitulation territory) = historically bullish, but hype divergences suggest reset needed before sustained rally.
- For traders: Conservative range trade ($88K–$94.8K for BTC; $2,900–$3,200 for ETH) = lowest-friction setup. Avoid chasing rallies into resistance without volume confirmation.
Market Snapshot (Data as of January 11, 2026)
In plain terms: Bitcoin recovered 2.1% this week but remains stuck below $95K. Ethereum outpaced BTC (+3.2%) but shows overbought signals and is losing relative strength. Macro backdrop is “risk-on” (stock market +1.6%, dollar rising) but institutional crypto demand is cooling after strong inflows on Jan 2.
| Asset | Current Price | 7d Change | Weekly Range | Market Cap | 24h Volume |
|---|---|---|---|---|---|
| BTC | $90,609 | +2.11% | $87,362–$94,825 | $1.789T (58% dominance) | $1.085B |
| ETH | $3,097 | +3.22% | $2,966–$3,308 | $373B (12% dominance) | $461.7M |
| S&P 500 | 6,966 | +1.57% | 6,824–6,978 | — | $20.66T daily |
| DXY (USD) | 99.14 | +1.21% | 97.87–99.26 | — | — |
Macro context: The US dollar strengthened this week (headwind for crypto), but equity markets remain calm. No signs of forced liquidation; this is a “reset into strength,” not a panic washout.
Bitcoin Daily Price Action: Week 1 January 2026


Bitcoin opened Week 1 at $87,498 and rallied sharply to $94,825 on Jan 5 (Bank of America wealth adviser policy announcement). The surge was fueled by $471M in institutional ETF inflows, signaling serious institutional interest. However, price could not hold above $94.8K and pulled back to $91,000–$92,000 by Jan 7. By Jan 11, Bitcoin settled at $90,609 after experiencing mid-week ETF redemptions ($1.3B) and whale repositioning to exchanges.
The volume pattern is telling: highest volumes on Jan 5–6 during the inflow period, then declining volume during the pullback. This suggests the rally lacked sustained conviction—classic sign of “easy money” already taken off the table.
What Happened Last Week (Key Drivers)
Direct answer: Bitcoin rallied early in the week (+6% from Jan 1 to Jan 5) after Bank of America approved 1–4% crypto allocation for wealth advisers. Ethereum surged on technical recovery and staking demand. Mid-week ETF redemptions ($1.3B) and whale activity at exchanges signaled profit-taking, capping both assets below recent highs.
The catalyst breakdown:
- Bank of America Policy Shift (Jan 5): BoA’s wealth management team can now recommend 1–4% portfolio allocation to Bitcoin ETFs. Immediate impact: $471.3M in BTC ETF inflows on Jan 2–5, plus $174.5M in ETH funds. This is institutional tailwind, not retail FOMO.
- Retail Capitulation Signal (Jan 3–4): Fear & Greed Index dropped to 25–42 range (Extreme Fear territory). Historically, this marks local bottoms. Short liquidations are rising, suggesting margin positions were shaken out.
- Ethereum Network Growth Spike (Jan 7): Ethereum recorded the highest number of new addresses in the decade. This is bullish long-term but a classic “blow-off top” warning signal. Santiment analysts now target $2,600–$2,800 for a short-term correction to reset leverage.
- Whale Exchange Movement (Jan 5–8): Bitcoin’s largest 10-flow ratio hit a 10-month high. Interpretation: major holders are moving coins to exchanges, potentially positioning for exits. This creates “exit liquidity” risk if BTC rallies on low volume—whales could dump into the bid.
- ETF Flow Reversal (Jan 9): After strong inflows Jan 2–3, crypto ETFs saw $1.3B in net redemptions by Jan 9. This is profit-taking after a sharp 5-day rally, not conviction leaving.
- Fed Chair Nomination (Jan 9): Trump’s expected nomination (Kevin Hassett favored) signals dovish policy shift. Pro-crypto narrative, but still a rumor until confirmed. Volatility likely around any announcement.
Crypto Fear & Greed Index: Week 1 January 2026

The Fear & Greed Index captures market sentiment in real-time. This chart shows Week 1’s dramatic swing: starting at 38 (Fear) on Jan 1, dropping to 25 (Extreme Fear) on Jan 3–4 as retail panic sold, then gradually recovering to 42 (Fear) by Jan 11 as the institutional bid stabilized prices.
What this means: Extreme Fear historically signals that weak hands have been shaken out—bullish setup for relief rally. However, the slow recovery (rather than sharp reversal) suggests the rally is running out of steam. Combined with Ethereum’s network growth blow-off and whale positioning, this is a “relief not conviction” market. Don’t chase it higher without fresh catalysts.
BTC Technical Outlook (Levels + Scenarios)
Direct answer: Bitcoin is consolidating after a failed breakout above $95K. Support at $88K–$91K is holding, which is bullish. But whale positioning at exchanges and lack of sustained volume above $94.8K suggest the rally lacked conviction. Watch for a decisive break above $94.8K (50D MA) for bull confirmation; a close below $88K breaks the support floor.
Key levels & structure:
- Immediate support: $88,000–$91,000 (main floor; losing this = downside cascade risk)
- Resistance zone: $91,000–$94,800 (recent high; 50D MA at $94,180)
- Secondary resistance: $98,000–$102,000 (psychological + major breakout zone)
- Tertiary support: $82,000–$85,000 (CME gap zone; historical lows from Q4)
- Trend invalidation: Weekly close below $85,000 = downtrend confirmed; weekly close above $99,000 = breakout confirmed

Base Case (50% probability): Consolidation Range $88K–$95K
- What it looks like: BTC trades sideways for 5–7 days, testing support ($88K–$91K) 1–2 times, failing to break $95K resistance decisively.
- Why it happens: Whale exit liquidity concerns + mixed macro signals + low retail volume = no trend conviction.
- Trigger: Neutral macro data; stable ETF flows; no Fed surprise.
- Target: Range-bound, exiting week at $90K–$93K.
- Invalidation: Daily close below $88,000 or daily close above $95,500.
Bull Case (30% probability): Rally to $98K–$102K
- What it looks like: Fed Chair confirmation of dovish stance (e.g., Hassett named Jan 9–10) + BTC breaks $94.8K on volume + short squeeze momentum carry.
- Why it happens: Institutional FOMO from BoA policy + Fed dovish = capital rotation into risk assets; shorts panic-cover.
- Trigger: (1) Fed dovish nomination confirmed, (2) BTC closes above $94,800 on 2x average volume, (3) funding rates spike positive (>0.03%), (4) altcoin dominance declines (BTC strength).
- Target: $98K–$102K (first target); $110K+ (extended bull).
- Invalidation: Daily close below $88,000 for 2+ consecutive days, or negative macro shock (shock rate hike, US shutdown risk spikes).
Bear Case (20% probability): Correction to $82K–$85K
- What it looks like: Whale selling pressure as BTC rallies to $92K–$94K; ETF redemptions accelerate; macro risk-off (US shutdown rumor, Fed hawkish pivot).
- Why it happens: “Exit liquidity” scenario; meme coin collapse signals retail capitulation incomplete; macro headwind (DXY rallying).
- Trigger: (1) Whale ratio stays elevated + price rallies = distribution zone, (2) FOMC chatter shifts hawkish mid-week, (3) US government shutdown risk rises (Jan 20 deadline), (4) stock market shock (-3%+).
- Target: $82K–$85K (CME gap fill + historic support zone).
- Invalidation: Weekly close above $95,000; institutional bid defends $88K for 3+ days.
If you only watch 3 things for BTC this week:
- Support hold at $88K: Loss = cascade to $82K–$85K.
- Breakout trigger at $94,800: Volume needed (2x daily average). Without volume, it’s a fake-out.
- Whale exit risk: Monitor 10-flow ratio on CryptoQuant. If it declines while price rallies = capitulation; if it stays high = distribution.
Ethereum Daily Price Action: Week 1 January 2026

Ethereum’s chart tells a more bullish story than Bitcoin’s—at least on the surface. Price rallied from $2,966 (Jan 1) to $3,308 (Jan 5), an 11.5% gain in 4 days. This was driven by ETH ETF inflows ($174.5M) and the historic spike in network growth on Jan 7 (highest in decade). However, the network spike is not a bullish signal for near-term price—it’s a warning.
Why? Historic spikes in network growth often mark euphoria peaks, followed by sharp corrections as the retail FOMO clears out. Santiment’s analysis explicitly warns of this pattern: expect ETH to test $2,600–$2,800 next to “reset” the leverage and excitement.
By Jan 11, Ethereum consolidated at $3,097, showing relative weakness vs. BTC (which recovered better). This divergence is cautious.
ETH Technical Outlook (Levels + Scenarios)
Direct answer: Ethereum is the “surprise” outperformer this week (+3.2% vs BTC’s +2.1%), but overbought signals (RSI 68, Stoch RSI 91) warn of a pullback. The network growth spike on Jan 7 is a historic bull flag, but also a classic “blow-off” warning. Watch for ETH to either hold $2,900 (bullish) or break down to $2,600–$2,800 (short-term correction). Relative underperformance vs. BTC is a caution flag.
Key levels & structure:
- Immediate support: $2,900–$2,950 (psychological + 50D MA holding zone)
- Resistance zone: $3,100–$3,200 (daily resistance; Bollinger Band midpoint)
- Secondary resistance: $3,300–$3,400 (Bollinger Band upper; key breakout zone)
- Tertiary support: $2,600–$2,800 (Santiment correction target; cycle low zone)
- Trend invalidation: Weekly close below $2,600 = trend broken; weekly close above $3,300 = breakout confirmed

Base Case (50% probability): Consolidation $2,900–$3,200 (Slightly Bearish Bias)
- What it looks like: ETH trades sideways, testing $2,900 support 1–2 times; fails to break $3,200 resistance decisively. Overbought signals resolve with a 48-hour pullback to $3,000–$3,050.
- Why it happens: Network growth spike (Jan 7) was “blow-off” not breakout. Whale staking demand supports floor, but short-term leverage needs to shake out.
- Trigger: Neutral macro; ETH/BTC ratio declines (underperformance persists); institutional staking continues but volume dries up.
- Target: Consolidation exit at $3,050–$3,150.
- Invalidation: Daily close below $2,900 (support lost) or daily close above $3,250 (breakout confirmed).
Bull Case (30% probability): Rally to $3,300–$3,500
- What it looks like: ETH breaks $3,200 on volume; staking inflows accelerate; Ethereum upgrades narrative (Layer 2 scaling, Fusaka) drive institutional demand.
- Why it happens: Institutional ETF inflows (spot ETH launched 2025) + whale staking conviction + historical Jan seasonality for risk assets.
- Trigger: (1) ETH closes above $3,200 on 1.5x+ volume, (2) Whale staking queue remains at 2-year high, (3) ETH/BTC ratio stabilizes or rises (relative strength), (4) Ethereum Dencun/Fusaka upgrade hype accelerates.
- Target: $3,300–$3,400 (first), then $3,500+ (extended bull).
- Invalidation: Daily close below $2,900; ETH/BTC ratio breaks support; whale staking queue reverses sharply.
Bear Case (20% probability): Correction to $2,600–$2,800 (Santiment Alert)
- What it looks like: ETH pulls back sharply (3–5%) to $2,700–$2,800 zone; “hype reset” as retail stops FOMO-ing. Leverage liquidations spike (long positions get shaken). ETH/BTC declines further.
- Why it happens: Network growth spike (Jan 7) is textbook “blow-off top” indicator. Santiment analysts warn of this correction in their Jan 8 report. Leverage still elevated from Dec rally.
- Trigger: (1) Macro risk-off event, (2) Whale staking queue reverses (holders panic), (3) ETH underperformance vs. BTC accelerates, (4) Funding rates spike positive then reverse to negative (squeeze then collapse).
- Target: $2,600–$2,800 (Santiment zone; 12–15% downside from current).
- Invalidation: Weekly close above $3,200; Whale staking queue hits 3-year high; institutional ETF inflows accelerate.
ETH vs. BTC Relative Strength: ETH is outperforming on price (+3.2% vs +2.1%), but underperforming on conviction. BTC shows broader institutional interest (BoA policy). Watch the ETH/BTC ratio: if it declines this week, ETH’s outperformance is suspect. Historically, when altcoins spike into overbought during bear markets, they correct hardest.
If you only watch 3 things for ETH this week:
- Support hold at $2,900: Breach = accelerated downside to $2,600–$2,800.
- RSI/Stoch normalization: Watch for overbought signals to cool. Failure to cool = exhaustion likely.
- Whale staking trend: If queue starts reversing, it’s a warning sign. If it stays high, it’s a floor.
Flows, On-Chain, and Sentiment (What Matters This Week)
Direct answer: Institutional demand (BoA, ETFs) is real but momentum is slowing. Whale positioning at exchanges suggests distribution risk. Ethereum’s historic network growth spike is a bull flag but also a classic blow-off warning. Funding rates are neutral, which means no cascade liquidation risk—good news for stability, but also means no “easy” short squeeze.
Institutional ETF flows:
- Jan 2–5: +$1.5B net inflows (BTC $471M, ETH $174.5M) = strong institutional bid.
- Jan 6–9: -$1.3B net redemptions = profit-taking after 5-day rally.
- Takeaway: Flows are “buy dips, sell rips”—not conviction. No capitulation yet from institutions (i.e., a -50% drawdown wouldn’t be surprising if macro shock hits).
Whale & on-chain activity:
- Bitcoin 10-largest-flow ratio at 10-month high = major holders moving to exchanges = potential exit setup.
- Ethereum staking queue at 2-year high (1M+ validators) = holders locking up coins = long-term conviction, but no immediate catalyst.
- Stablecoin supply flat = no fresh buying power visible. If BTC rallies, it’s from squeeze/liquidations, not fresh inflows.
- Takeaway: Structure is mixed. Whales are positioning but not yet selling. If BTC rallies into $94K–$96K zone, watch for distribution.
Sentiment & Fear/Greed:
- Fear & Greed Index: 25–42 (Extreme Fear). Historically, this is a “buy signal,” but it’s overstated.
- The problem: Meme coins show divergence (PEPE, others) = retail FOMO still present = not true capitulation yet.
- Ethereum network growth spike (Jan 7) = highest in decade = “blow-off top” warning in Santiment analysis. Correction likely.
- Crypto Fear & Greed Index readings show: Extreme Fear historically = next 7 days often rally +3–5%, but with whipsaws.
- Takeaway: Sentiment is oversold, but internals are deteriorating. Don’t chase rallies yet; wait for capitulation finish (new lows in network activity, whale panic selling).
Funding rates:
- BTC/ETH funding rates returned to neutral (~0.01% baseline).
- But brief negative spike (-0.002%) suggests shorts are accumulating = short squeeze risk if BTC breaks $91K–$94K.
- Takeaway: Low leverage = low cascade risk, but also = weak rally conviction. No free money here.
What would change this view:
- Bullish flip: Whale staking queue continues to 1.5M+ validators (2-year+ high) = conviction. Or major institution (MicroStrategy, corporate treasury) announces significant buy. Or Fed dovish signal confirmed Jan 9–10.
- Bearish flip: US government shutdown risk rises (Jan 20 deadline). Or Ethereum staking queue reverses (holders panic). Or whale exit liquidity hits in next 48h.
Trade Plan Templates (Beginner-Friendly)
Quick reminder: These are frameworks, not signals. Risk management is everything. Never risk more than 1–2% of your account on a single trade. Use stop-losses. If a trade hits your stop-loss, journal it and move on—no revenge trading.
Template 1: Conservative Range Trade (Lowest Risk)
Best for: Traders who want low-stress, high-probability setups.
Setup (Bitcoin):
- Entry zone: $88,500–$90,000 (test support, buy dip).
- Take-profit targets:
- TP1: $91,500 (+1.5–3.5% return) — take 50%.
- TP2: $93,500–$94,500 (+5–6% return) — take 30%.
- Trailing stop final 20% above $95,000.
- Stop-loss: Daily close below $88,000 (invalidates support thesis).
- Position sizing: Risk 1% max. If BTC drops to $87,500, that’s your stop = max loss 1%.
- Duration: 3–5 days. Exit by Friday if no breakout to $95K+.
Setup (Ethereum):
- Entry zone: $2,950–$3,050 (test support, buy dip).
- Take-profit targets:
- TP1: $3,150 (+3–5% return) — take 50%.
- TP2: $3,200–$3,250 (+5–8% return) — take 30%.
- Trailing stop final 20% above $3,300.
- Stop-loss: Daily close below $2,900 (support lost).
- Position sizing: Risk 1% max.
- Duration: 3–5 days. Exit by Friday.
Watchlist for invalidation:
- Whales moving coins off exchanges (bullish signal; hold winners).
- Funding rates spike to +0.03%+ (euphoria; take profits).
- Stablecoin inflows accelerate (fresh money; let winners run).
Template 2: Trend Continuation / Breakout Plan (Medium Risk)
Best for: Traders with 2–4 week patience; those willing to ride volatility.
Setup (Bitcoin Bullish Breakout):
- Wait for: Daily close above $94,800 on 1.5x+ volume (triggers the break).
- Entry: Long on retest of $94,800 or on breakout if volume stays strong.
- Targets:
- T1: $98,000 (+8% from entry) — 1/3 position.
- T2: $102,000 (+12% from entry) — 1/3 position.
- T3: $110,000+ (extended bull, trail stop at $105K).
- Stop-loss: Daily close below $91,000 (breaks the uptrend line).
- Position sizing: Risk 1.5–2% max (volatility will be higher).
- Timeline: 7–14 days to first target.
Invalidation watch:
- Volume dries up after breakout = fake breakout, exit 1/2 position.
- Whale ratio declines + price rallies = distribution zone, reduce size.
- Macro headline (Fed hawkish surprise, shutdown risk) = exit entirely, no hesitation.
Template 3: Risk-Off / Hedge Plan (If Volatility Spikes)
Best for: Traders worried about macro shock or correction.
Setup:
- Trigger: If BTC closes below $88,000 OR macro shock hits (announcement of US shutdown, Fed hawkish pivot, -3%+ stock market drop).
- Position: Reduce longs by 50%. Set trailing stop at 2% above entry for remaining longs.
- Hedge option (if you use derivatives):
- Buy put options / short BTC 3–5% down (small hedge, max 5–10% of portfolio).
- Or simply go to cash and wait for new support test.
- Target for BTC if breakdown happens: $82,000–$85,000 (CME gap zone).
- Target for ETH if breakdown happens: $2,600–$2,800 (Santiment correction zone).
- Re-entry plan: Wait for new support test + volume exhaustion (e.g., 3–5 down days, fear spike). Then enter Template 1 setup at new support.
Do NOT do:
- Over-leverage on the way down (doubling down).
- Ignore your stop-losses (emotions = losses).
- Trade against the trend without strong risk management.
Weekly Routine (10 Minutes/Day + 45 Minutes/Week)
Goal: Stay informed without obsessing. Use this routine to make one decision per day.
Daily (10 minutes, 8 AM / 8 PM UTC+7):
- Market check (2 min):
- Is BTC above or below $91,000? ETH above or below $3,000?
- Quick scan: Up/down/sideways. Any big news headlines?
- Level check (3 min):
- Did price test any key support/resistance overnight? (e.g., did BTC touch $88K?)
- If yes, log it. Pattern = information.
- Macro scan (3 min):
- Any Fed speakers or economic data this session? (Check fed.gov, Investing.com calendar.)
- Any crypto-specific news (whale move, ETF flow, regulatory)? (Check Crypto Twitter / Santiment.)
- Trade decision (2 min):
- Is price at an entry zone? (e.g., $88.5K–$90K for BTC, or $2,950–$3,050 for ETH?)
- If yes → Execute Template 1 (range trade) or Template 2 (if breakout triggered).
- If no → Hold existing positions or stay in cash. No FOMO entries above resistance.
Weekly (45 minutes, Friday evening or Sunday evening):
- Week recap (10 min):
- What was the narrative? (e.g., “BoA policy drove inflows → whale distribution risk → Fed uncertainty.”)
- Did your forecasts pan out? (e.g., Did BTC stay in $88K–$95K range? Yes = forecast correct; No = what was missed?)
- Update levels (15 min):
- Adjust support/resistance based on new price action.
- Add new on-chain signals (staking queue, whale flows, exchange inflows).
- Check funding rates, Fear & Greed, Santiment alerts.
- Scenario reassess (15 min):
- Probability check: Was it 50% base case, or did bears/bulls win?
- Update next week’s base case with new info.
- Plan 2–3 trade setups for Week 2.
- Journal (5 min):
- One-sentence trade log: Entry, exit, P&L, lesson learned.
- Example: “Entered BTC $89.2K, exited $92.3K, +3.1% win. Lesson: Don’t hold for TP2 if volume dies—take profits early.”
Weekly triggers to adjust the forecast:
| If This Happens | New Bias | Action |
|---|---|---|
| BTC closes above $95K on 2x volume | BULLISH → Bull case probability +20% | Shift Template 2 (breakout) into play. |
| ETH closes below $2,900 on 1.5x volume | BEARISH → Bear case probability +20% | Reduce size. Set tight trailing stop. |
| Fed names dovish chair (e.g., Hassett) | BULLISH FOR MONTH | Hold winners. Let bulls run. Plan for $100K target. |
| US shutdown risk rises above 50% | BEARISH SHORT-TERM | Reduce longs. Hedge 5–10% of portfolio. |
| Whale staking queue hits 1.5M validators | BULLISH ETH CONVICTION | Scale into ETH above $3,050. |
| Crypto Fear & Greed drops below 15 | CAPITULATION | Buy signal. But verify with on-chain. Don’t rush. |
Conclusion
What matters most this week: Bitcoin’s consolidation between $88K and $95K is normal, not bearish. The real test is whether institutions (BoA policy, ETF buyers) can push the market above $95K on volume, or if whales dump into the relief rally. Ethereum’s network growth spike is exciting for the long-term, but a short-term correction to $2,600–$2,800 would be healthy and unsurprising.
Key reminder: Forecasts are maps, not destinations. Price always has the final say. The three scenarios above cover 100% of reasonable outcomes for Week 2. If something outside these scenarios happens (e.g., Bitcoin drops 20% in a day due to a macro shock), then the forecast is invalidated, and a new one is needed. That’s not a failure—it’s how markets work.
Your job this week:
- Reduce risk where possible. Use stop-losses. Size positions small (1–1.5% risk per trade).
- Wait for the setup. Don’t chase BTC above $95K without 1.5x volume. Don’t buy ETH into $3,300 resistance without volume. Patience pays.
- Journal every trade. One sentence: entry, exit, result, lesson. Over 10–20 trades, you’ll see your edge.
- Trust the levels. If support ($88K BTC, $2,900 ETH) holds, the base case (consolidation) is winning. If support breaks, shift to the bear case and reduce size.
This article is educational, not financial advice. Do your own research. Manage risk. Never trade with money you can’t afford to lose.
Discover CoinXSight – The all-in-one crypto platform featuring AI price predictions, whale tracking, and a specialized Solana meme hunter. Elevate your trading strategy today.
Discover more from aiCryptoHub.io
Subscribe to get the latest posts sent to your email.


